
Refinance Delivers Balance Sheet Strength and Flexibility
MAC Copper Limited ARBN 671 963 198 (NYSE: MTAL; ASX:MAC)
This press release features multimedia. View the full release here: https://www.businesswire.com/news/home/20250429768600/en/
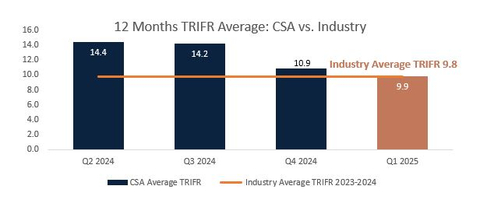
Figure 1 - CSA Copper Mine Recordable Injuries by Quarter
MAC Copper Limited (NYSE: MTAL; ASX: MAC), a private limited company incorporated under the laws of Jersey, Channel Islands (“MAC” or the “Company”) is pleased to release its March 2025 quarterly activities report (“Q1 2025” or “March quarter”).
HIGHLIGHTS
Quarterly production of 8,644 tonnes at a 4.1% Cu grade
- Continued improvement in TRIFR to 9.9 in Q1 2025 from a TRIFR of 14.2 recorded for 2024
- 8,644 tonnes of copper produced for Q1 2025 at a 4.1% Cu grade with quarterly production variability driven by timing of when a small number of large tonnage, high-grade stopes are mined in a year
- C1 of US$1.91/lb1 increased by ~14.7% (US$1.66/lb for Q4 2024), mainly due to decrease in production volume partly offset by a circa 70% reduction in 2025 TC/RC benchmarks
- Q1 2025 Total Cash Costs of US$2.47/lb increased by ~7% (US$2.31/lb for Q4 2024)
-
Outlook for 2025 C1 positively impacted by:
- a circa 70% reduction in TC/RC benchmarks (~US$0.16/lb2 reduction compared to 2024)
- AUD operational costs benefit from a lower AUD:USD exchange rate (1 US$ cent = ~US$0.03/lb)
- March 2025 C1 of US$1.49/lb with ~4,000 tonnes of copper produced at a grade of 4.7% Cu
Targeting copper production of >50ktpa by 2026
- Growing copper production by circa 23% by 20263 with key major projects delivering the step change
- Merrin Mine – development commenced in Q4 2024, ore mining expected to commence from Q4 2025
- Ventilation project – progressing in line with plan, advancing with completion targeted by Q3 2026
- Sustaining capex of ~US$7.2 million for Q1 2025 positively impacted by accelerated spend in Q4 2024
Refinance completed with increased liquidity, flexibility and balance sheet strength
- Cash and cash equivalents of ~US$75 million (~A$119 million) after completion of refinance
- Very strong liquidity of US$153.3 million (~A$243.4 million) includes ~US$8.0 million of outstanding QP receipts, ~US$8.2 million of unsold concentrate and Polymetals investment of US$2.9 million
- New facilities (US$159 million term loan and US$125 million revolving facility) in place from 13 March 2025 with a repayment holiday to 30 September 2025
- New repayment profile provides for ~US$123 million in reduced repayments over period to December 2026
- Reducing the average weighted cost of debt by ~30%4 to approximately 6.85% (variable rate)
- Interest cash savings of approximately US$14 million per annum5 with repayment of the Mezzanine Facility of ~US$160 million including capitalised interest to June 2025 and 4% premium
ESG UPDATE
Safety
Achieved a Total Recordable Injury Frequency Rate (TRIFR) of 9.9 in Q1 2025, a material improvement from an average TRIFR of 10.9 in Q4 2024 and a TRIFR of 14.2 for 2024.
The positive momentum that was achieved at the end of CY2024 was maintained, with both the total number of incidents recorded and the severity of these incidents reducing significantly during the quarter.
Figure 1 - CSA Copper Mine Recordable Injuries by Quarter6
Sustainability Report
MAC recognizes the importance of our environmental, social and governance responsibilities and that sustainability strategies more broadly is integral to the way we operate and essential to the accomplishment of our goals.
As a result, in 2024 MAC completed a materiality assessment and stakeholder analysis to identify the key environmental, social and governance issues material to the business and important to our stakeholders.
To this end we published our inaugural annual sustainability report on 28 March 2025, which provides an overview of our material ESG topics, a summary of current performance and an outline of future activities and initiatives to improve our reporting and disclosures over time.
Regulatory
The CSA Annual Rehabilitation Report was submitted in April 2025. There have been no reportable environmental incidents during the March 2025 quarter following no reportable environmental incidents for CY2024.
Construction activities on the Stage 10 embankment raise have been ongoing with works on the foundation and development of the key trench within the West Mound targeted for completion in Q2 2025, before progressing to the East Mound construction. The Stage 10 TSF embankment provides TSF capacity out to 2030 and is one of the 3 main capital projects being undertaken in 2025.
PRODUCTION AND COST SUMMARY
Table 1 – Production and cost summary (unaudited)
Units |
Q1 2024 |
Q2 2024 |
Q3 2024 |
Q4 2024 |
Q1 2025 |
QoQ Change (%) |
|
Copper Production |
Tonnes |
8,786 |
10,864 |
10,159 |
11,320 |
8,644 |
(23.6%) |
Sustaining capital |
US$ million |
$13.0 |
$12.8 |
$12.5 |
$12.4 |
$7.2 |
(42.0%) |
Cash cost (C1)7 |
US$/lb |
$2.15 |
$2.028 |
$1.90 |
$1.66 |
$1.91 |
14.7% |
Total cash cost9 |
US$/lb |
$3.17 |
$2.72 |
$2.71 |
$2.31 |
$2.47 |
7.2% |
Group Net Debt10 |
US$ million |
$253 |
$232 |
$232 |
$132 |
$150 |
13.4% |
MAC Copper Limited’s CEO, Mick McMullen, said:
“Our team continued to build on the positive momentum achieved at the end of 2024 with a further reduction in not only the total incidents recorded but also the severity of these incidents during the quarter with TRIFR reducing further to 9.9, materially down from the 2024 TRIFR of 14.2. The heightened awareness and focus of our people continued benefiting from the extensive training and coaching with increased field safety leadership interactions. As always there is nothing more important than the health and well-being of our people, and the communities we are proud to be a part of.
The March 2025 quarter is always the seasonally lowest production quarter at the CSA Copper Mine and this is what we have seen again in 2025. It followed a very strong December 2024 quarter and we expect to see production rates build again during the year, exactly as we saw in 2024.
Copper production is driven by small number of large tonnage, high grade stopes and the timing of when these are sequenced in the year. As a result Q1 2025 copper production decreased by 24% to 8,644 tonnes at 4.1% Cu with a higher grade stope only accessed in the latter part of March.
Although our C1 for the March 2025 quarter increased by approximately 15% due to the decrease in copper production volume, the C1 for the month of March 2025 set a new low under MAC ownership of $1.49/lb with around 4,000 tonnes of copper being produced in the month, further showcasing the low cost nature of the CSA Copper mine.
We are also making progress on delivering on our growth strategy by targeting a further increase of ~23% to over 50,000 tonnes of copper equivalent production per annum by 2026 compared to 2024 supported by our two key growth projects which include the expansion of the mine to include the new Merrin Mine and bringing the Ventilation project online by Q4 2025 and Q3 2026 respectively. The Merrin Mine has the ability to impact our production in the near term and this is being accelerated with additional equipment and people being assigned to this area.
Significantly, at the end of the quarter, we successfully amended our debt facilities and further simplified our balance sheet through the early repayment of the Sprott mezzanine facility and refinancing not only the term debt but also upsized the revolving facility by US$100 million to US$125 million and further extended the maturity of these facilities to June 2028. Our interest cost will also reduce by US$14 million per annum with the average weighted cost of debt reducing by circa 30% to approximately 6.85% currently. This will allow us to not only deliver on our growth strategy but further look at how we can increase shareholder returns in the future.
MAC is positioned for growth and well supported by a strong and flexible balance sheet with operational improvements to drive costs down from what is already a highly competitive cost position. We have some exciting growth opportunities with the new Merrin Mine in the upper levels of the mine and with the continued push to complete the Capital Ventilation Project, we are also working hard to unlock our mining potential at the lower levels of the mine as well.”
OPERATIONAL AND COST UPDATE
Table 2 - Quarterly Operational Performance of the CSA Copper Mine (unaudited)
CSA Copper Mine Metrics (unaudited) |
Units |
Q1 2024 |
Q2 2024 |
Q3 2024 |
Q4 2024 |
Q1 2025 |
QoQ % variance |
U/g development – Capital (ex Merrin Mine) |
Metres |
466 |
449 |
735 |
464 |
468 |
1% |
U/g development – Operating |
Metres |
703 |
611 |
359 |
449 |
404 |
(10%) |
Rehab |
Metres |
246 |
113 |
145 |
246 |
412 |
67% |
Total development |
Metres |
1,415 |
1,173 |
1,239 |
1,159 |
1,283 |
11% |
Ore Mined |
Tonnes |
256,031 |
271,469 |
238,937 |
285,613 |
214,443 |
(25%) |
Tonnes Milled |
Tonnes |
260,297 |
266,936 |
260,953 |
284,490 |
214,678 |
(25%) |
Copper grade processed |
% |
3.5% |
4.2% |
4.0% |
4.1% |
4.1% |
1% |
Copper Recovery |
% |
97.6% |
97.9% |
97.2% |
97.9% |
98.2% |
0% |
Copper Produced |
Tonnes |
8,786 |
10,864 |
10,159 |
11,320 |
8,644 |
(24%) |
Silver Produced |
Ounces |
102,182 |
134,072 |
112,299 |
114,019 |
111,383 |
(2%) |
Copper Sold |
Tonnes |
8,112 |
12,984 |
10,244 |
8,987 |
7,400 |
(18%) |
Achieved Copper price11 |
US$/lb |
3.87 |
4.41 |
4.18 |
4.18 |
4.27 |
2% |
Achieved Copper price (including hedging) |
US$/lb |
3.81 |
4.24 |
4.04 |
4.02 |
4.04 |
0% |
Mining Cost |
US$/t Mined |
$95.7 |
$91.9 |
$85.9 |
$75.2 |
$92.4 |
23% |
Processing Cost |
US$/t Milled |
$25.7 |
$31.9 |
$26.3 |
$25.7 |
$37.4 |
46% |
G+A Cost |
US$/t Milled |
$33.1 |
$25.6 |
$27.5 |
$24.9 |
$35.3 |
42% |
Total Operating Cost |
US$/t milled |
$154.6 |
$149.3 |
$139.6 |
$125.8 |
$165.1 |
31% |
Development Cost |
US$/metre |
$15,478 |
$9,330 |
$12,825 |
$12,633 |
$10,933 |
(13%) |
Sustaining Capital Expenditure12 |
US$ million |
$13.0 |
$12.8 |
$12.5 |
$12.4 |
$7.2 |
(42%) |
Tonnes Milled per employee |
t/employee |
184 |
186 |
174 |
191 |
148 |
(22%) |
Mining |
US$/lb prod |
1.27 |
1.04 |
0.92 |
0.86 |
1.04 |
21% |
Processing |
US$/lb prod |
0.35 |
0.36 |
0.31 |
0.29 |
0.42 |
44% |
General and Admin |
US$/lb prod |
0.44 |
0.28 |
0.32 |
0.28 |
0.40 |
40% |
Treatment and refining |
US$/lb prod |
0.17 |
0.26 |
0.23 |
0.19 |
0.06 |
(71%) |
Work in Progress inventory |
US$/lb prod |
(0.14) |
0.03 |
0.02 |
0.00 |
0.01 |
438% |
Freight and other costs |
US$/lb prod |
0.17 |
0.21 |
0.24 |
0.15 |
0.12 |
(19%) |
Silver Credits |
US$/lb prod |
(0.10) |
(0.16) |
(0.14) |
(0.11) |
(0.14) |
26% |
C1 Cash Cost |
US$/lb prod |
2.15 |
2.0213 |
1.90 |
1.66 |
1.91 |
15% |
Leases |
US$/lb prod |
0.08 |
0.07 |
0.07 |
0.06 |
0.08 |
27% |
Inventory WIP |
US$/lb prod |
0.14 |
(0.03) |
(0.02) |
0.00 |
(0.01) |
(438%) |
Royalties |
US$/lb prod |
0.13 |
0.13 |
0.20 |
0.08 |
0.12 |
53% |
Sustaining capital |
US$/lb prod |
0.67 |
0.53 |
0.56 |
0.50 |
0.38 |
(24%) |
Total Cash Cost |
US$/lb prod |
3.17 |
2.72 |
2.71 |
2.31 |
2.47 |
7% |
Total Revenue |
US$ millions |
66.0 |
120.0 |
87.5 |
74.9 |
70.3 |
(6%) |
Unless stated otherwise all references to dollar or $ are in USD.
Although a decrease in production from prior quarters, Q1 2025 demonstrated consistent mining processes setting up the remainder of 2025 with production guidance maintained. Production further benefited from a grade of 4.1% for Q1 2025 with copper grade for the month of March 2025 recorded at 4.7%. The grade achieved continues to demonstrate the high-quality ore body present at CSA mine.
Figure 2 - CSA Copper Mine Quarterly Copper Production (tonnes)
The average received copper price after hedge settlements was slightly higher compared with the prior quarter with Q1 2025 at US$4.04/lb, compared to US$4.02/lb for Q3 2024, with the average spot copper price over the March quarter at ~US$4.23/lb due to the copper hedges at ~US$3,72/lb in place to May 2026.
C1 cash costs increased by ~15% quarter on quarter from US$1.66/lb in the December quarter to US$1.91/lb for Q1 2025. The lower production tonnes, as detailed above, resulted in a negative impact to C1 of approximately US$0.52/lb, whilst the overall cost variance mainly driven by a ~70% lower TC/RC benchmarks for 2025 had a positive impact of approximately US$0.27/lb.
Figure 3 - CSA Copper Mine C1 Cash Costs14 - US$/lb produced
MAC management continues to implement additional productivity measures to further reduce C1 costs as is evident in the declining C1 that has been achieved over the course of 2024 as noted in Figure 3.
Q1 2025 reflects a 15% decrease in C1 as compared to the corresponding March quarter in 2024 of US$2.15/lb which is a strong result given general cost trends within the copper industry that many of our peers are experiencing.
Figure 4 provides an illustration of tonnes milled per employee which decreased ~22% quarter on quarter in line with decreased ore milled of 25%.
Figure 4 - CSA Mine Tonnes Milled per Employee
Figure 5 - CSA Mine Mining Unit Rate US$/t
Apart from copper production, the largest driver of C1 costs is the mining unit rate as mining accounts for approximately 60% of total site operating costs.
Mining unit rates trending down with better cost control initiatives implemented combined with additional tonnes mined in 2024. There was a 25% reduction in ore mined in Q1 2025 compared to the previous quarter which is the main driver of the mining unit rate per tonne increasing by around 23%.
Figure 6 - CSA Copper Mining Development Costs US$M
Figure 7 - CSA Copper Mine Capital Development metres
The ~13% decrease in cost per development metre related to the ~47% increase in Capital Vent metres completed in Q1 2025 compared to Q4 2024 while the overall development metres remained steady which reduced the overall gross development costs incurred.
Underground capital development of 468 metres (up 1% quarter on quarter), includes 340 metres for Capital Vent project completed during Q1 2025 and excludes 227 metres of capital development in the Merrin Mine.
Processing costs per tonne milled increased in March 2025 quarter in line with reduced tonnes milled. A planned plant shut also occurred in February impacting both tonnes and maintenance costs. Tonnes processed for the quarter were 214kt (being a 25% decrease quarter on quarter) at a Cu recovery of 98.2%.
G&A unit rates increased in the current quarter predominately driven by the decrease in ore processed.
Figure 8 - CSA Copper Mine Processing Unit Rate US$/t
Figure 9 - CSA Copper Mine Site G+A Unit Rate US$/t
As seen in Figure 10, capital spend (including capitalized development) decreased over the quarter. Capital costs during the quarter included diamond drilling and stage 10 TSF works. Decrease quarter on quarter predominately relates to timing of capital spend and larger spend in the December 2024 quarter as well as lower capitalised development costs due to lower gross mining costs incurred in the quarter.
Figure 10 - CSA Copper Mine Site Capital US$M
PROJECTS AND EXPLORATION UPDATE
Pathway to >50,000 tonne per annum of copper equivalent production
The CSA mine is already benefiting from productivity improvements initiated under MAC ownership such as double stope lifts and operational efficiencies aimed at reducing waste and ensuring efficient delivery of ore.
To further progress towards becoming a 50ktpa+ copper equivalent producer in 2026 and beyond there are two key projects that are essential to achieve this being the Ventilation project which is due for completion Q3 2026 and the opening up of the new Merrin Mine with first ore expected in Q4 2025.
The delivery of both these are essential to achieve our strategic goal of uplifting production to over 50,000 tonnes of copper equivalent production by 2026 and start unlocking the full potential of the CSA copper mine.
Projects updates
Merrin Mine update
The new Merrin Mine presents an opportunity for incremental copper production at CSA Mine, representing an additional mining area not currently connected to the bottom of the mine, located approximately 150m below the surface. Drilling to upgrade this deposit from resource to reserve in some areas has been completed, with ore mining expected to commence by Q4 2025.
Total spend in Q1 2025 was US$0.8 million, primarily allocated to project startup and equipment costs. The first development cut was taken in Q4 2024, marking a significant milestone in the project's progression. All key project team members are now in place, and the installation of new services from the surface has been completed. The underground substation has been installed, and back-stripping activities are underway in preparation for the secondary fan installation. Development will continue to increase in rate as the project ramps up.
Development rates are materially faster (and cheaper) in the Merrin Mine than the existing mining areas and no real constraints. In Q1 2025 a total of 227 metres of capital development was completed. The Company has added additional fleet and people in this area to further accelerate production.
As drilling and mining of this area progresses, the Company has discovered additional mineralisation not previously considered in the mine plan. This includes an up-dip extension to the QTS S Upper deposit that has extended that ore body by approximately 70 metres towards surface and additional massive sulphide lenses of both Cu and Zn in the drive towards QTSS U.
The up-dip extensions of QTSS U have extended that deposit by approximately 20% and are typical intersections for that deposit that range from 3-4 metres wide at grades of 10-20% Cu and form an attractive mining target.
Figure 11 – Merrin Mine
Figure 12 – Merrin Mine High Grade Copper
Figure 13 – Merrin Mine Development
Planning is also underway to carry out close spaced drilling of the first areas to be mined for zinc. Polymetals Resources Ltd (“POL”) is making good progress on their restart of the Endeavour mine and MAC has high grade zinc mineralisation available for mining very close to existing development when the Endeavour mill is ready to process it.
Subsequent to the end of the quarter, MAC invested a further A$2.5m at A$0.35/share in POL with POL shares closing the March quarter at A$0.88.
Ventilation project update
The Capital Vent Upgrade Project is designed to support increased mining activity and improving access to lower mine levels and ensuring operational longevity beyond the current reserve life. The project remains a key enabler for sustained production growth at CSA.
Total spend in Q1 2025 was US$3.3 million, with 340m of development completed. Progress continued on establishing access to the first raise bore location, additional geotechnical drilling was completed, and procurement of ventilation fans advanced.
The project is progressing well, with development successfully integrated into existing operations. Early works in high-activity mining areas have supported a structured ramp-up, ensuring alignment with operational priorities. The slowest development rates are in the early stages of the project as development interacts with existing mining, and as development moves out away from the operations development rates are picking up as planned.
The project is expected to be completed by Q3 2026.
TREASURY UPDATE
Cash position, liquidity and debt facilities
The Company’s unaudited cash holding at the end of Q1 2025 was ~US$75 million or ~A$119 million for an unaudited net debt position of ~US$150 million. The decrease in the cash position at quarter end compared to 31 December 2024 is largely driven by the repayment of the Sprott Mezzanine facility of ~US$160 million with the refinancing of the senior debt facility providing further liquidity.
There were ~US$21.7 million of cash received for copper concentrate sold to Glencore on 25 March 2025 for which we received the cash with revenue to be accounted for early April 2025. The unaudited cash position also reflects ~US$2.5 million in interest payments for the newly refinanced Senior facility.
As of 31 March 2025, the pro-forma liquidity was ~US$153 million (~A$243 million) which includes cash of ~US$75 million (A$119 million), US$59 million (A$94 million) undrawn revolving facility, ~US$8 million (A$13 million) of outstanding Quotational Period receipts, unsold concentrate and the strategic investment held in POL at valuation as at 31 March 2025 of ~A$18 million (~US$11 million).
Debt Refinance Complete
On 13 March 2025 MAC announced that it successfully amended its debt and further simplified its balance sheet through the early repayment of the Sprott mezzanine facility.
As outlined in previous announcements, MAC utilised the proceeds from it’s A$150 million (~US$103 million) equity raising in October 2024 to repay the Sprott mezzanine facility.
MAC also refinanced its debt facilities with the key changes outlined below.
- Old MAC facilities comprised of a US$159 million term loan facility, an undrawn US$25 million revolving credit facility, a US$145 million mezzanine facility15 and a A$45 million environmental bond (“Old Facilities”).
- New MAC facilities comprise of a US$159 million term loan facility, an upsized US$125 million revolving credit facility extended to 14 March 2028 and a A$45 million environmental bond now provided by three Australian Banks (“New Facilities”).
The key highlights of the New Facilities are:
- Simplification of MAC’s balance sheet through the early repayment of the Sprott mezzanine facility.
- A syndicate of six banks (including three Australian banks for the first time) providing the New Facilities.
- New Facilities have a longer dated maturity of 14 March 2028, including repayment holiday to 30 September 2025.
- Updated repayment profile defers ~US$123 million of previously scheduled principal repayments into 2027.
- Revolving credit facility upsized by US$100 million to US$125 million, providing additional liquidity.
- New Facilities reduce MAC’s average weighted cost of debt by ~30%16 to approximately 6.85%17.
- Interest cash savings of approximately US$14 million per annum18.
The full form documentation also continues to recognise that the contingents are not payable, even if triggered, before 16 June 2026, other than from available free cash flow and only after satisfaction of all operating costs and debt servicing costs as per the agreed cash flow waterfall.
Figure 14: Debt Maturity Profile (US$M):
Figure 15 – Q1 2025 Cash flow waterfall (US$M)
TC/RC renegotiated pricing
Benchmark Treatment Charge and Refining Charge (“TC/RC”) pricing has been renegotiated and a new benchmark set for 2025, as such, from 1 January 2025 Copper refining charges decreased by ~74% to approximately US$21/t for the TC and US$0.21/ refined lb of copper for the RC.
Using 2024 results as a base, the impact of this reduction amounts to ~US$14.6 million per annum in savings equating to a reduction in C1 cost of ~US$0.16/lb year on year.
FX Impact on OPEX
Given MAC is dual listed in Australia and the US, our financial performance is affected by movements in A$:US$ exchange rate with site costs predominantly Australian dollar based.
As an estimate, utilising 2024 results as a baseline, the impact of a US$1 cent movement on the A$:US$ exchange rate would have an impact of ~US$2.7M on total operating costs, being a ~US$0.03/lb impact on C1.
Hedging
As part of the initial Debt Facility Agreement to purchase the CSA copper mine, MAC Copper had to implement a hedging program covering the period to June 2026. During the quarter, the Company delivered 3,105 tonnes of copper into this hedge book at a price of US$3.72/lb. A summary of our open hedge positions as at 31 March 2025 is included below.
Table 3 – Hedge position
|
Copper |
||
|
2025 |
2026 |
Total |
Future Sales (t) |
9,315 |
5,175 |
14,490 |
Future Sales ($/t) |
3.72 |
3.72 |
3.72 |
CONFERENCE CALL DETAILS
The Company will host a conference call and webcast to discuss the Company’s first quarter 2025 results on Wednesday, April 29, 2025 at 7:00 pm (New York time) / Wednesday, April 30, 2025 at 9:00 am (Sydney time).
Details for the conference call and webcast are included below.
Webcast
Participants can access the webcast at the following link https://ccmediaframe.com/?id=moVh1ReO
Conference Call
Participants can register for the call at https://s1.c-conf.com/diamondpass/10046155-8xzq0a.html
After registering you will receive a confirmation email containing information about joining the conference call and webcast.
Replay
A replay of the webcast will be available via the webcast link above or by visiting the Events section of the Company’s website.
This report is authorised for release by Mick McMullen, CEO & Director.
ABOUT MAC COPPER LIMITED
MAC Copper Limited (NYSE: MTAL) is a company focused on operating and acquiring metals and mining businesses in high quality, stable jurisdictions that are critical in the electrification and decarbonization of the global economy.
Estimates of Mineral Resources and Ore Reserves and Production Target
This release contains estimates of Ore Reserves and Mineral Resources as well as a Production Target. The Ore Reserves, Mineral Resources and Production Target are reported in MAC’s ASX Announcement dated 23 April 2024 titled ‘Updated Resource and Reserve Statement and Production Guidance’ (the R&R Announcement). The Company is not aware of any new information or data that materially affects the information included in the R&R Announcement, and that all material assumptions and technical parameters underpinning the estimates or Ore Reserves and Mineral Resources in the R&R Announcement continue to apply and have not materially changed. The material assumptions underpinning the Production Target in the R&R Announcement continue to apply and have not materially changed. It is a requirement of the ASX Listing Rules that the reporting of ore reserves and mineral resources in Australia comply with the JORC Code. Investors outside Australia should note that while exploration results, mineral resources and ore reserves estimates of MAC in this presentation comply with the JORC Code, they may not comply with the relevant guidelines in other countries and, in particular, do not comply with (i) National Instrument 43-101 (Standards of Disclosure for Mineral Projects) of the Canadian Securities Administrators; or (ii) the requirements adopted by the Securities and Exchange Commission (SEC) in its Subpart 1300 of Regulation S-K. Information contained in this presentation describing mineral deposits may not be comparable to similar information made public by companies subject to the reporting and disclosure requirements of Canadian or US securities laws.
Forward Looking Statements
This release includes “forward-looking statements.” The forward-looking information is based on the Company’s expectations, estimates, projections and opinions of management made in light of its experience and its perception of trends, current conditions and expected developments, as well as other factors that management of the Company believes to be relevant and reasonable in the circumstances at the date that such statements are made, but which may prove to be incorrect. Assumptions have been made by the Company regarding, among other things: the price of copper, continuing commercial production at the CSA Copper Mine without any major disruption, the receipt of required governmental approvals, the accuracy of capital and operating cost estimates, the ability of the Company to operate in a safe, efficient and effective manner and the ability of the Company to obtain financing as and when required and on reasonable terms. Readers are cautioned that the foregoing list is not exhaustive of all factors and assumptions which may have been used by the Company. Although management believes that the assumptions made by the Company and the expectations represented by such information are reasonable, there can be no assurance that the forward-looking information will prove to be accurate.
MAC’s actual results may differ from expectations, estimates, and projections and, consequently, you should not rely on these forward-looking statements as predictions of future events. Words such as “expect,” “estimate,” “project,” “budget,” “forecast,” “anticipate,” “intend,” “plan,” “may,” “will,” “could,” “should,” “believes,” “predicts,” “potential,” “continue,” and similar expressions (or the negative versions of such words or expressions) are intended to identify such forward- looking statements. These forward-looking statements include, without limitation, MAC’s expectations with respect to future performance of the CSA Copper Mine. These forward-looking statements involve significant risks and uncertainties that could cause the actual results to differ materially from those discussed in the forward-looking statements. Most of these factors are outside MAC’s control and are difficult to predict. Factors that may cause such differences include, but are not limited to: the supply and demand for copper; the future price of copper; the timing and amount of estimated future production, costs of production, capital expenditures and requirements for additional capital; cash flow provided by operating activities; unanticipated reclamation expenses; claims and limitations on insurance coverage; the uncertainty in Mineral Resource estimates; the uncertainty in geological, metallurgical and geotechnical studies and opinions; infrastructure risks; and other risks and uncertainties indicated from time to time in MAC’s other filings with the SEC and the ASX. MAC cautions that the foregoing list of factors is not exclusive. MAC cautions readers not to place undue reliance upon any forward-looking statements, which speak only as of the date made. MAC does not undertake or accept any obligation or undertaking to release publicly any updates or revisions to any forward-looking statements to reflect any change in its expectations or any change in events, conditions, or circumstances on which any such statement is based.
More information on potential factors that could affect MAC’s or CSA Copper Mine’s financial results is included from time to time in MAC’s public reports filed with the SEC and the ASX. If any of these risks materialize or MAC’s assumptions prove incorrect, actual results could differ materially from the results implied by these forward-looking statements. There may be additional risks that MAC does not presently know, or that MAC currently believes are immaterial, that could also cause actual results to differ from those contained in the forward-looking statements. In addition, forward-looking statements reflect MAC’s expectations, plans or forecasts of future events and views as of the date of this communication. MAC anticipates that subsequent events and developments will cause its assessments to change. However, while MAC may elect to update these forward-looking statements at some point in the future, MAC specifically disclaims any obligation to do so, except as required by law. These forward-looking statements should not be relied upon as representing MAC’s assessment as of any date subsequent to the date of this communication. Accordingly, undue reliance should not be placed upon the forward-looking statements.
Non-IFRS financial information
MAC’s results are reported under International Financial Reporting Standards (IFRS), noting the results in this report have not been audited or reviewed. This release may also include certain non-IFRS measures including C1, Total Cash costs and Free Cash Flow. These C1, Total Cash cost and Free Cash Flow measures are used internally by management to assess the performance of our business, make decisions on the allocation of our resources and assess operational management. Non-IFRS measures have not been subject to audit or review and should not be considered as an indication of or alternative to an IFRS measure of financial performance.
C1 Cash Cost
C1 costs are defined as the costs incurred to produce copper at an operational level. This includes costs incurred in mining, processing and general and administration as well freight and realisation and selling costs. By-product revenue is credited against these costs to calculate a dollar per pound metric. This metric is used as a measure operational efficiency to illustrate the cost of production per pound of copper produced.
Total Cash Cost
Total cash costs include C1 cash costs plus royalties and sustaining capital less inventory WIP movements. This metric is used as a measure operational efficiency to further illustrate the cost of production per pound of copper produced whilst incurring government-based royalties and capital to sustain operations.
Free Cash Flow
Free cash flow is defined as net cash provided by operating activities less additions to property, plant, equipment and mineral interests. This measure, which is used internally to evaluate our underlying cash generation performance and the ability to repay creditors and return cash to shareholders, provides investors with the ability to evaluate our underlying performance.
| _____________________________ | ||
1 |
|
See “Non-IFRS financial information” and refer to table 2 for reconciliation of C1 Cash Cost and Total cash cost. |
2 |
|
Calculated based on mid-point of 2025 production guidance. |
3 |
|
Comparing 2024 actuals and mid-point of 2026 production guidance range. |
4 |
|
Comparing the current weighted average interest cost of ~9.72% to an all-in interest rate of ~6.85%. The new interest rate is linked to SOFR and a leverage margin grid. |
5 |
|
Full year of interest savings based on current interest rate differential. |
6 |
|
Industry TRIFR source: Mine Safety performance report 2023-2024, Resource regulator Department of Regional NSW. |
7 |
|
See “Non-IFRS Information” and refer to table 2 for reconciliation of C1 Cash Cost. |
8 |
|
Q2 2024 adjusted post finalisation of half year accounts with additional freight and TCRCs included accrued for recognition of June pre-sales. |
9 |
|
Excludes corporate costs from parent entity. See “Non-IFRS financial information” and refer to table 2 for reconciliation of Total Cash Cost. |
10 |
|
Senior Debt + Mezzanine Facility – Cash and cash equivalents (excluding streams). |
11 |
|
Realised provisional sales price excluding hedging impact. |
12 |
|
Sustaining capex only. |
13 |
|
Q2 2024 adjusted post finalisation of half year accounts with additional freight and TCRCs included accrued for recognition of June pre-sales. |
14 |
|
See “Non-IFRS Information” and refer to table 2 for reconciliation of C1 Cash Cost. |
15 |
|
Refer to MAC’s ASX announcement titled ‘MAC Copper Limited and Sprott Amend Loan Agreement to Permit Early Repayment’ dated 17 December 2024 for further details. |
16 |
|
Comparing the current weighted average interest cost of ~9.72% to an all-in interest rate of ~6.85%. The new interest rate is linked to SOFR and a leverage margin grid. |
17 |
|
Based on SOFR at time of announcement plus a margin based on a leveraged margin grid. |
18 |
|
Full year of interest savings based on current interest rate differential. |
View source version on businesswire.com: https://www.businesswire.com/news/home/20250429768600/en/
Contacts
Mick McMullen
Chief Executive Officer
MAC Copper Limited
investors@metalsacqcorp.com
Morné Engelbrecht
Chief Financial Officer
MAC Copper Limited